Chapter 6 McCrary Density Test
We can use local polynomial density estimations with RDDensity and LPDensity commands. The McCrary density test can test to see if there were any manipulations in the running variable at the cutoff. Our null hypothesis for the McCrary density test is no manipulation around the cutoff.
We want to make sure that the following are not occurring:
- The assignment rule is known in advance
- Economic agents are interested in adjusting
- Economic agents have time to adjust
- The cutoff is not exogenous (or is endogenous with other factors)
- There is non-random heaping along the running variable
When we look at arbitrary rules known in advanced, such as the FMLA cutoff at 50 employees, we see a pileup or heaping of firms with 49 employees. Such that, the density of firms with 49 employees is much greater than the density of firms with 50 employees. Firms are economic agents self-selecting into 49 employees to avoid regulation.
net install rddensity, from(https://raw.githubusercontent.com/rdpackages/rddensity/master/stata) replace
net install lpdensity, from(https://raw.githubusercontent.com/nppackages/lpdensity/master/stata) replaceComputing data-driven bandwidth selectors.
Point estimates and standard errors have been adjusted for repeated observations.
(Use option nomasspoints to suppress this adjustment.)
RD Manipulation test using local polynomial density estimation.
c = 0.500 | Left of c Right of c Number of obs = 13577
-------------------+---------------------- Model = unrestricted
Number of obs | 5480 8097 BW method = comb
Eff. Number of obs | 1994 2250 Kernel = triangular
Order est. (p) | 2 2 VCE method = jackknife
Order bias (q) | 3 3
BW est. (h) | 0.081 0.103
Running variable: demvoteshare.
------------------------------------------
Method | T P>|T|
-------------------+----------------------
Robust | 0.3628 0.7168
------------------------------------------
P-values of binomial tests. (H0: prob = .5)
-----------------------------------------------------
Window Length / 2 | <c >=c | P>|T|
-------------------+----------------------+----------
0.000 | 10 11 | 1.0000
0.001 | 16 23 | 0.3368
0.001 | 31 34 | 0.8043
0.002 | 43 36 | 0.4999
0.002 | 55 43 | 0.2664
0.003 | 63 58 | 0.7163
0.003 | 74 71 | 0.8682
0.004 | 84 77 | 0.6364
0.004 | 90 86 | 0.8212
0.004 | 96 97 | 1.0000
-----------------------------------------------------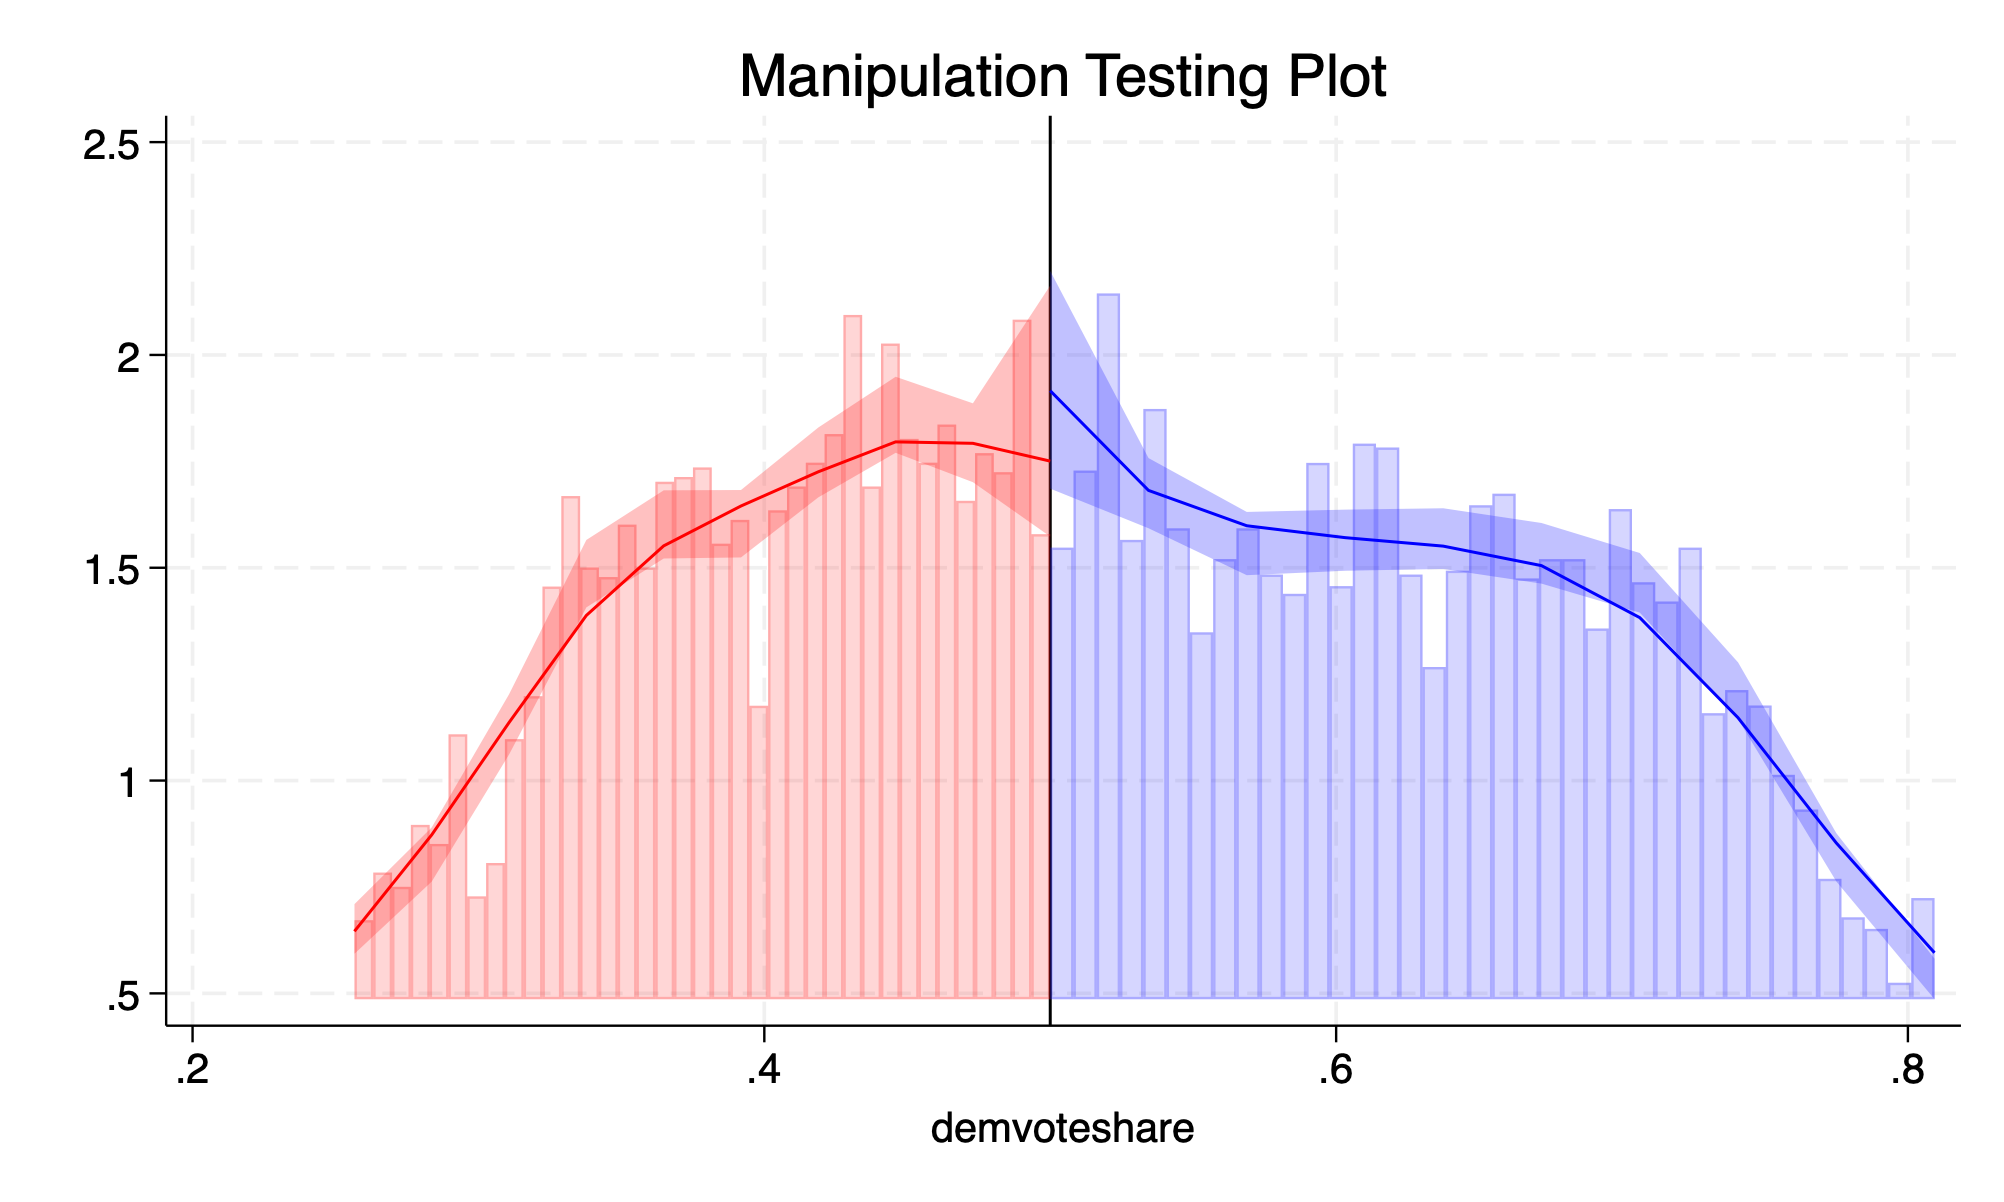
We fail to reject the null hypothesis, and we do not see evidence of maninupation around the cutoff.
Stata code attributed to Marcelo Perraillon.